Projects

A collection of information design projects. Hover over each final diagram to see the Input from the client.
Artboard 3 copy 2

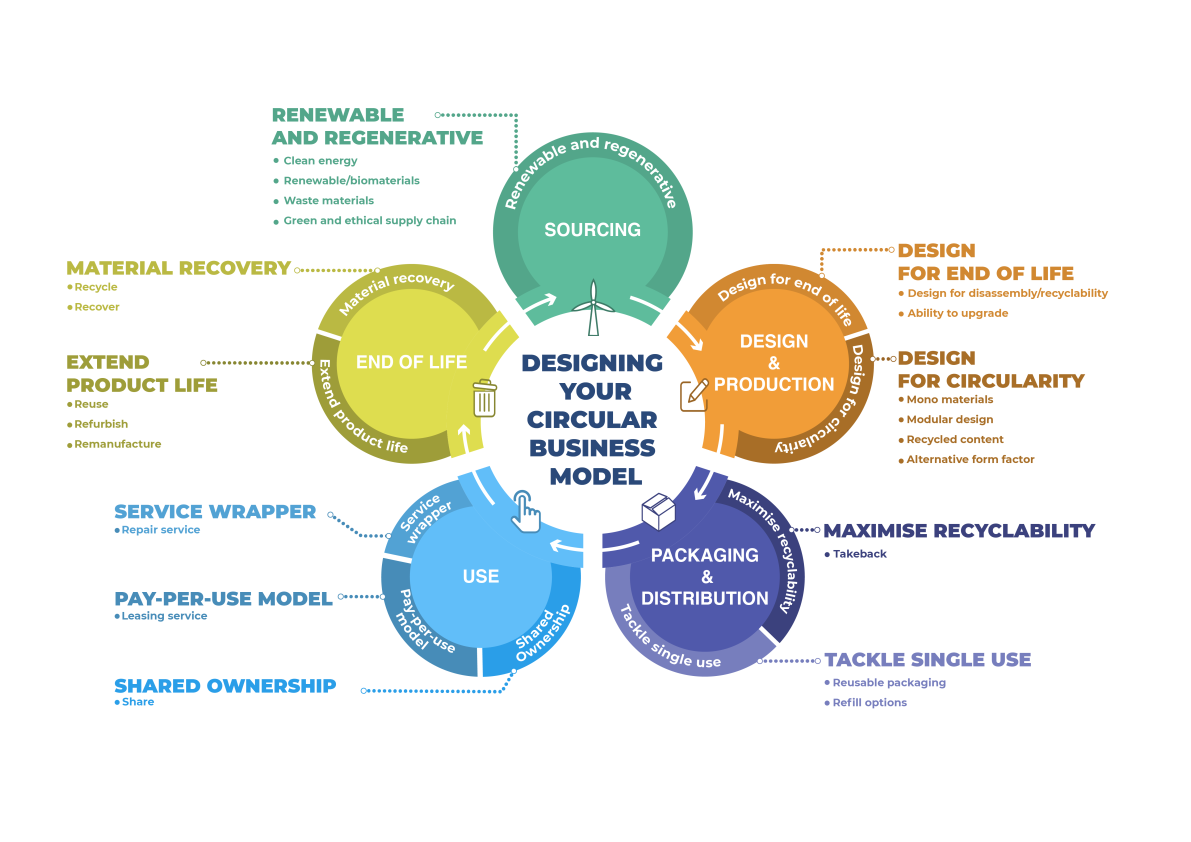
The Output:

A comprehensive, five-stage regenerative cycle. This model maps out specific actionable strategies to retain value, reduce environmental footprint
image005

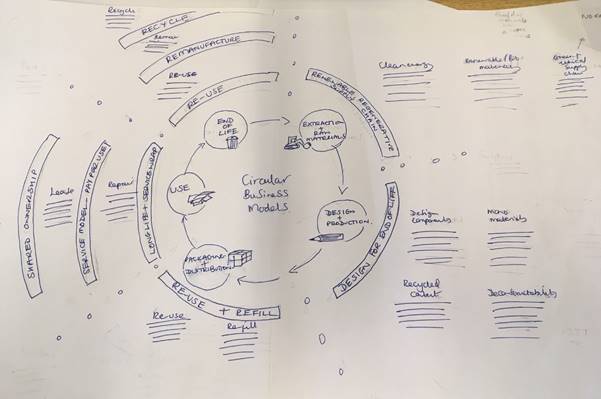
Project: how sustainability can be integrated into every business

The Input: A messy, overlapping sketch of a consultancy company's services and approach.
A4

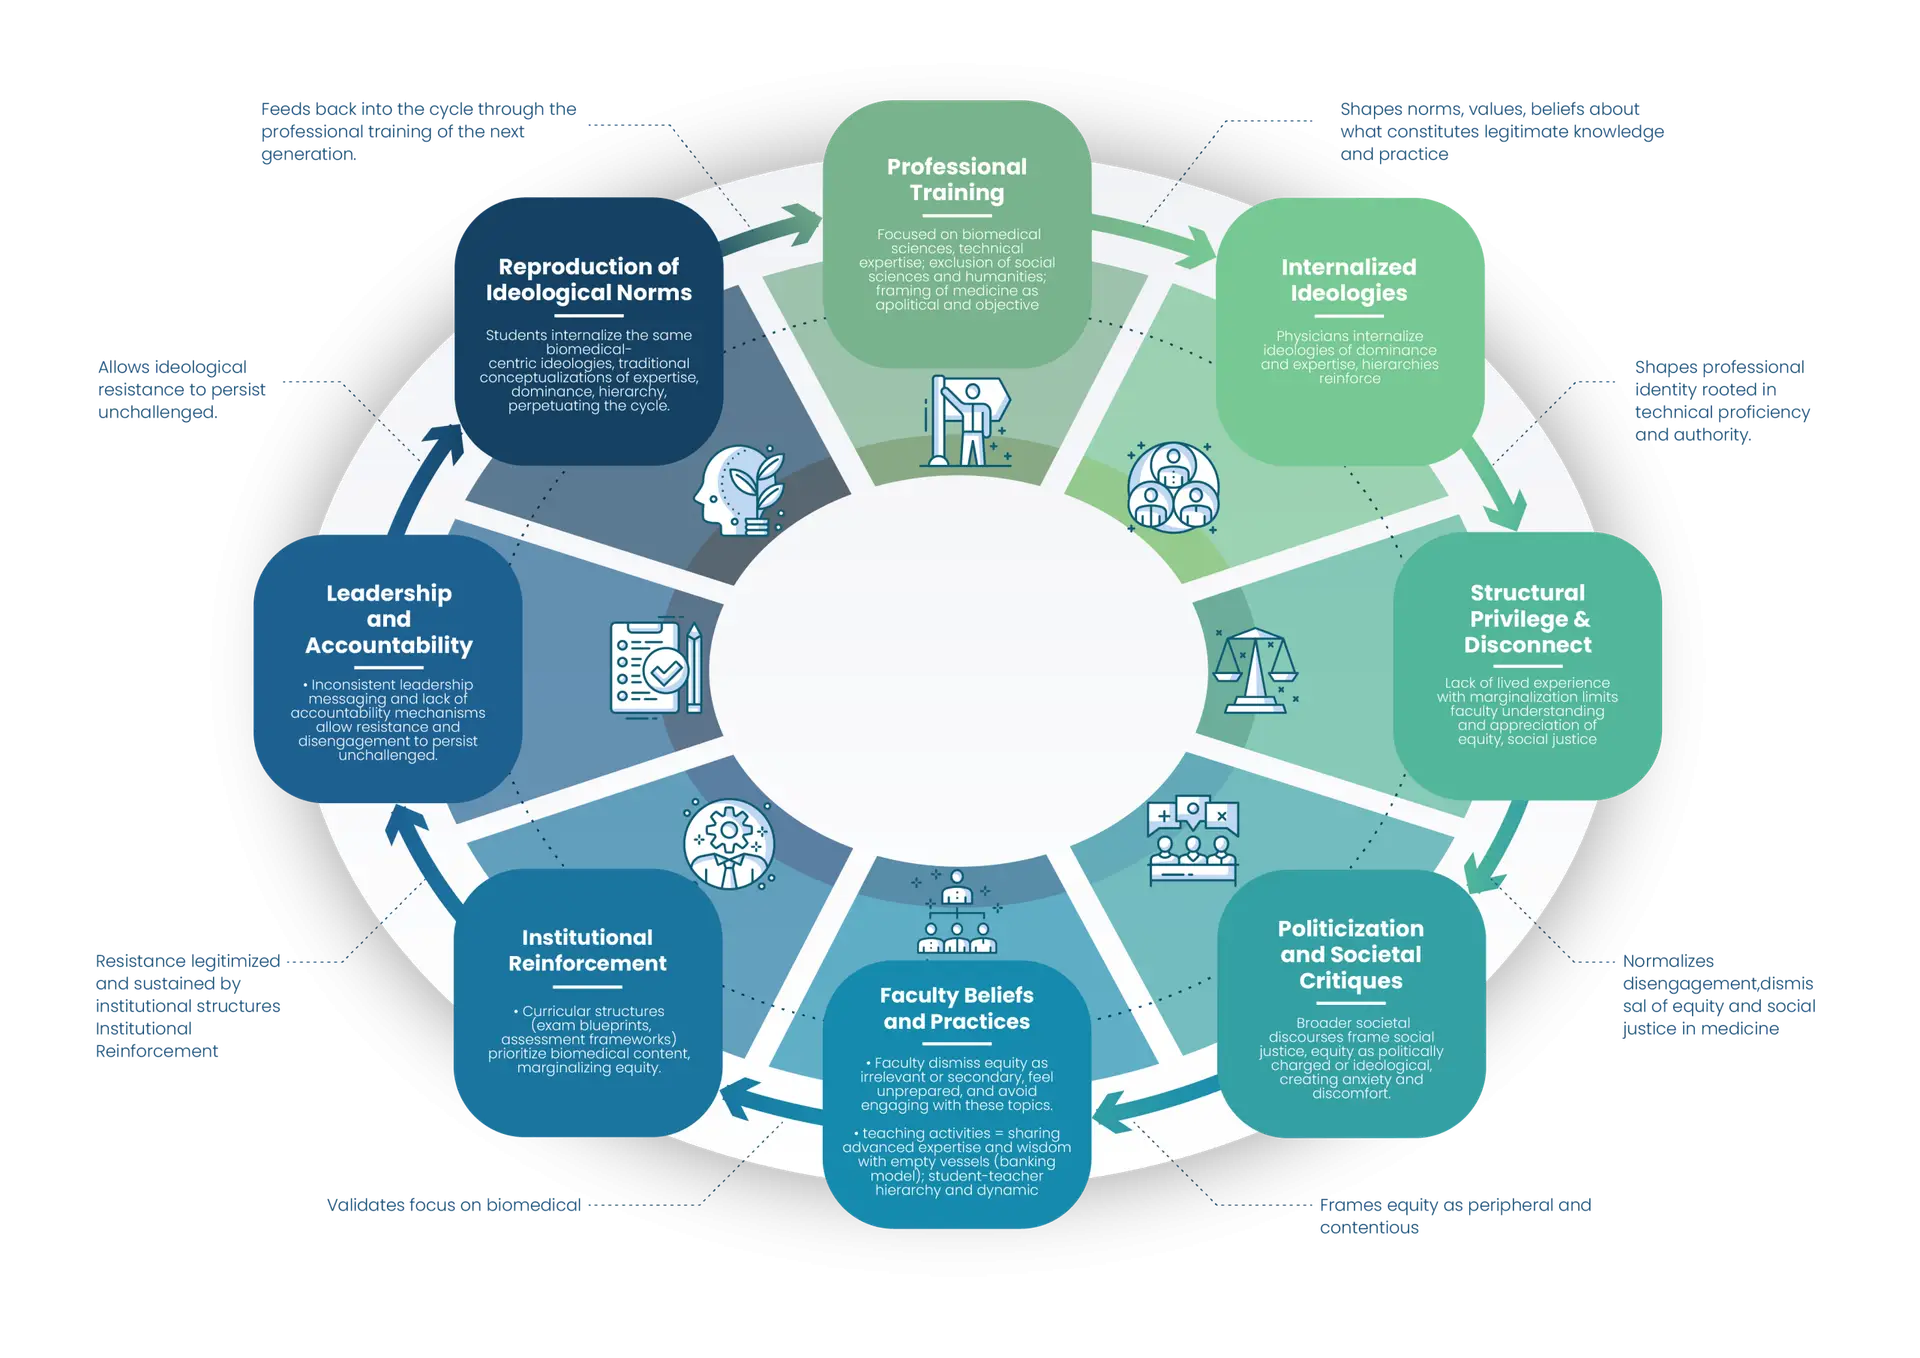
The Output:

A clean, multi-level circular diagram that visualizes the "feedback loop" of professional socialization, breaking down the systemic process into eight interconnected phases.
Screenshot 2025-01-18 at 8.20.10 PM

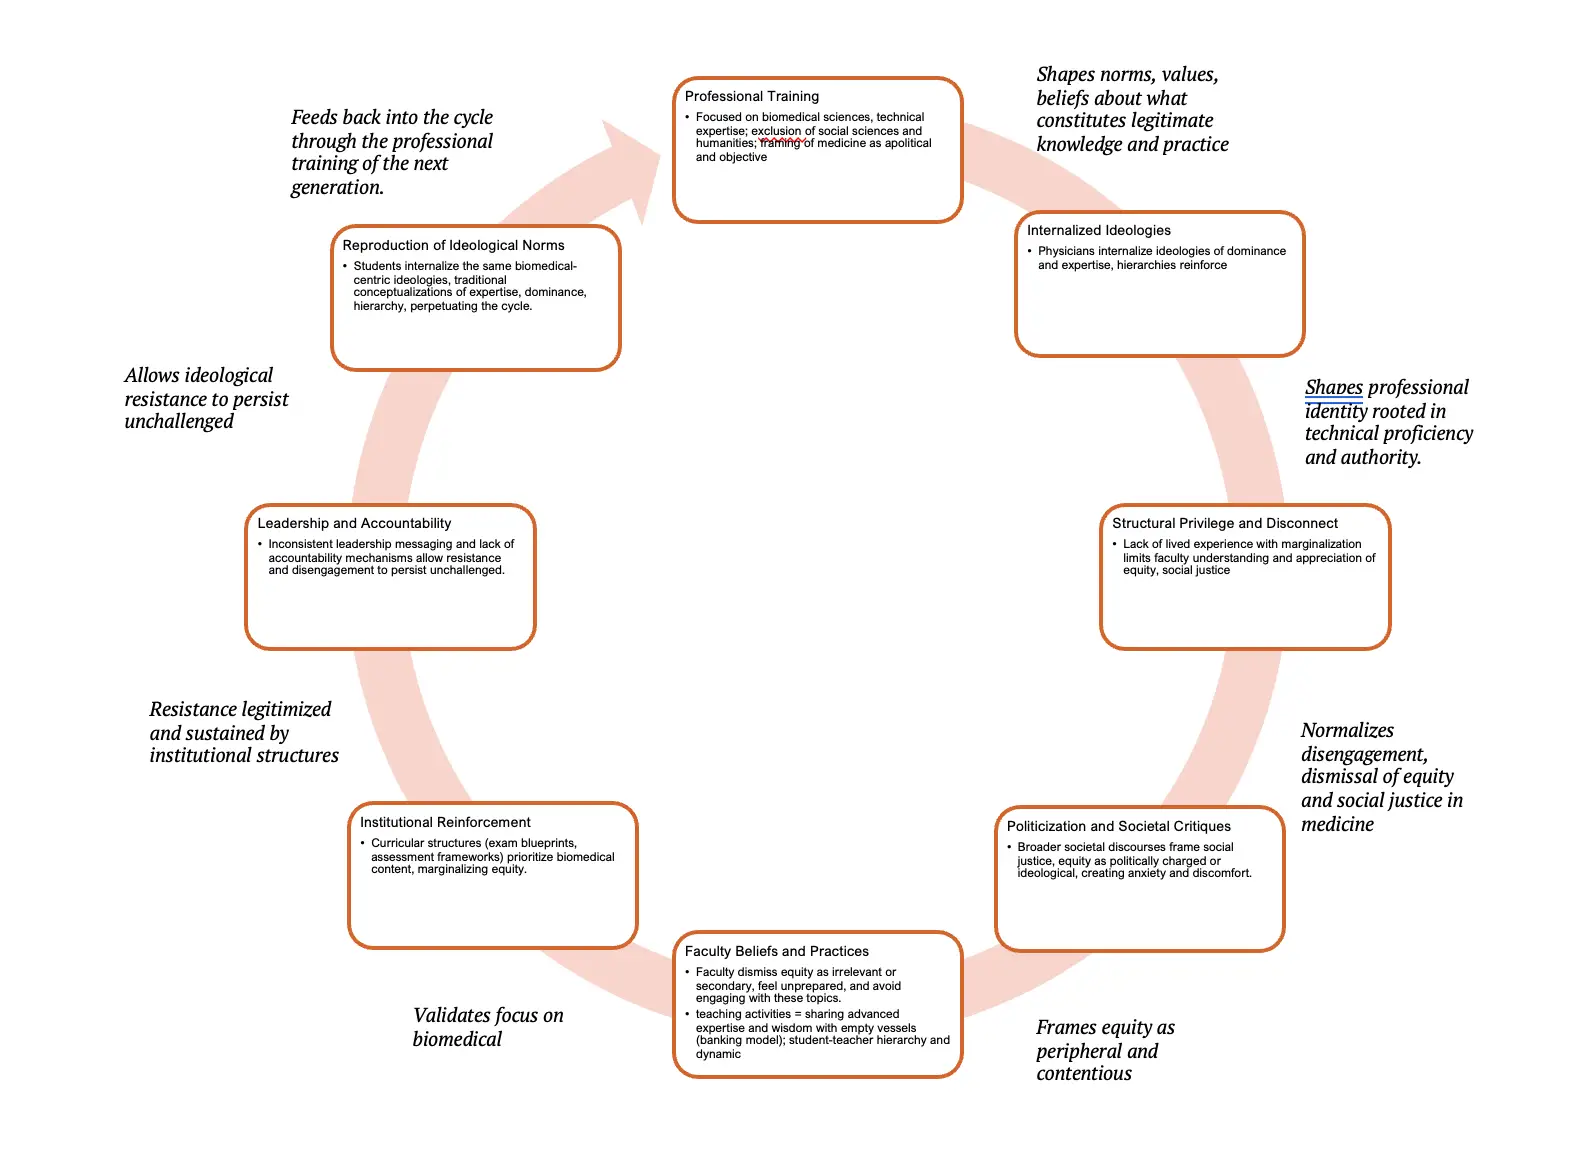
Project: the Cycle of Ideological Reproduction in Medical Education

The Input: collection of qualitative research data and a basic diagram.
Diagram design

The Output:

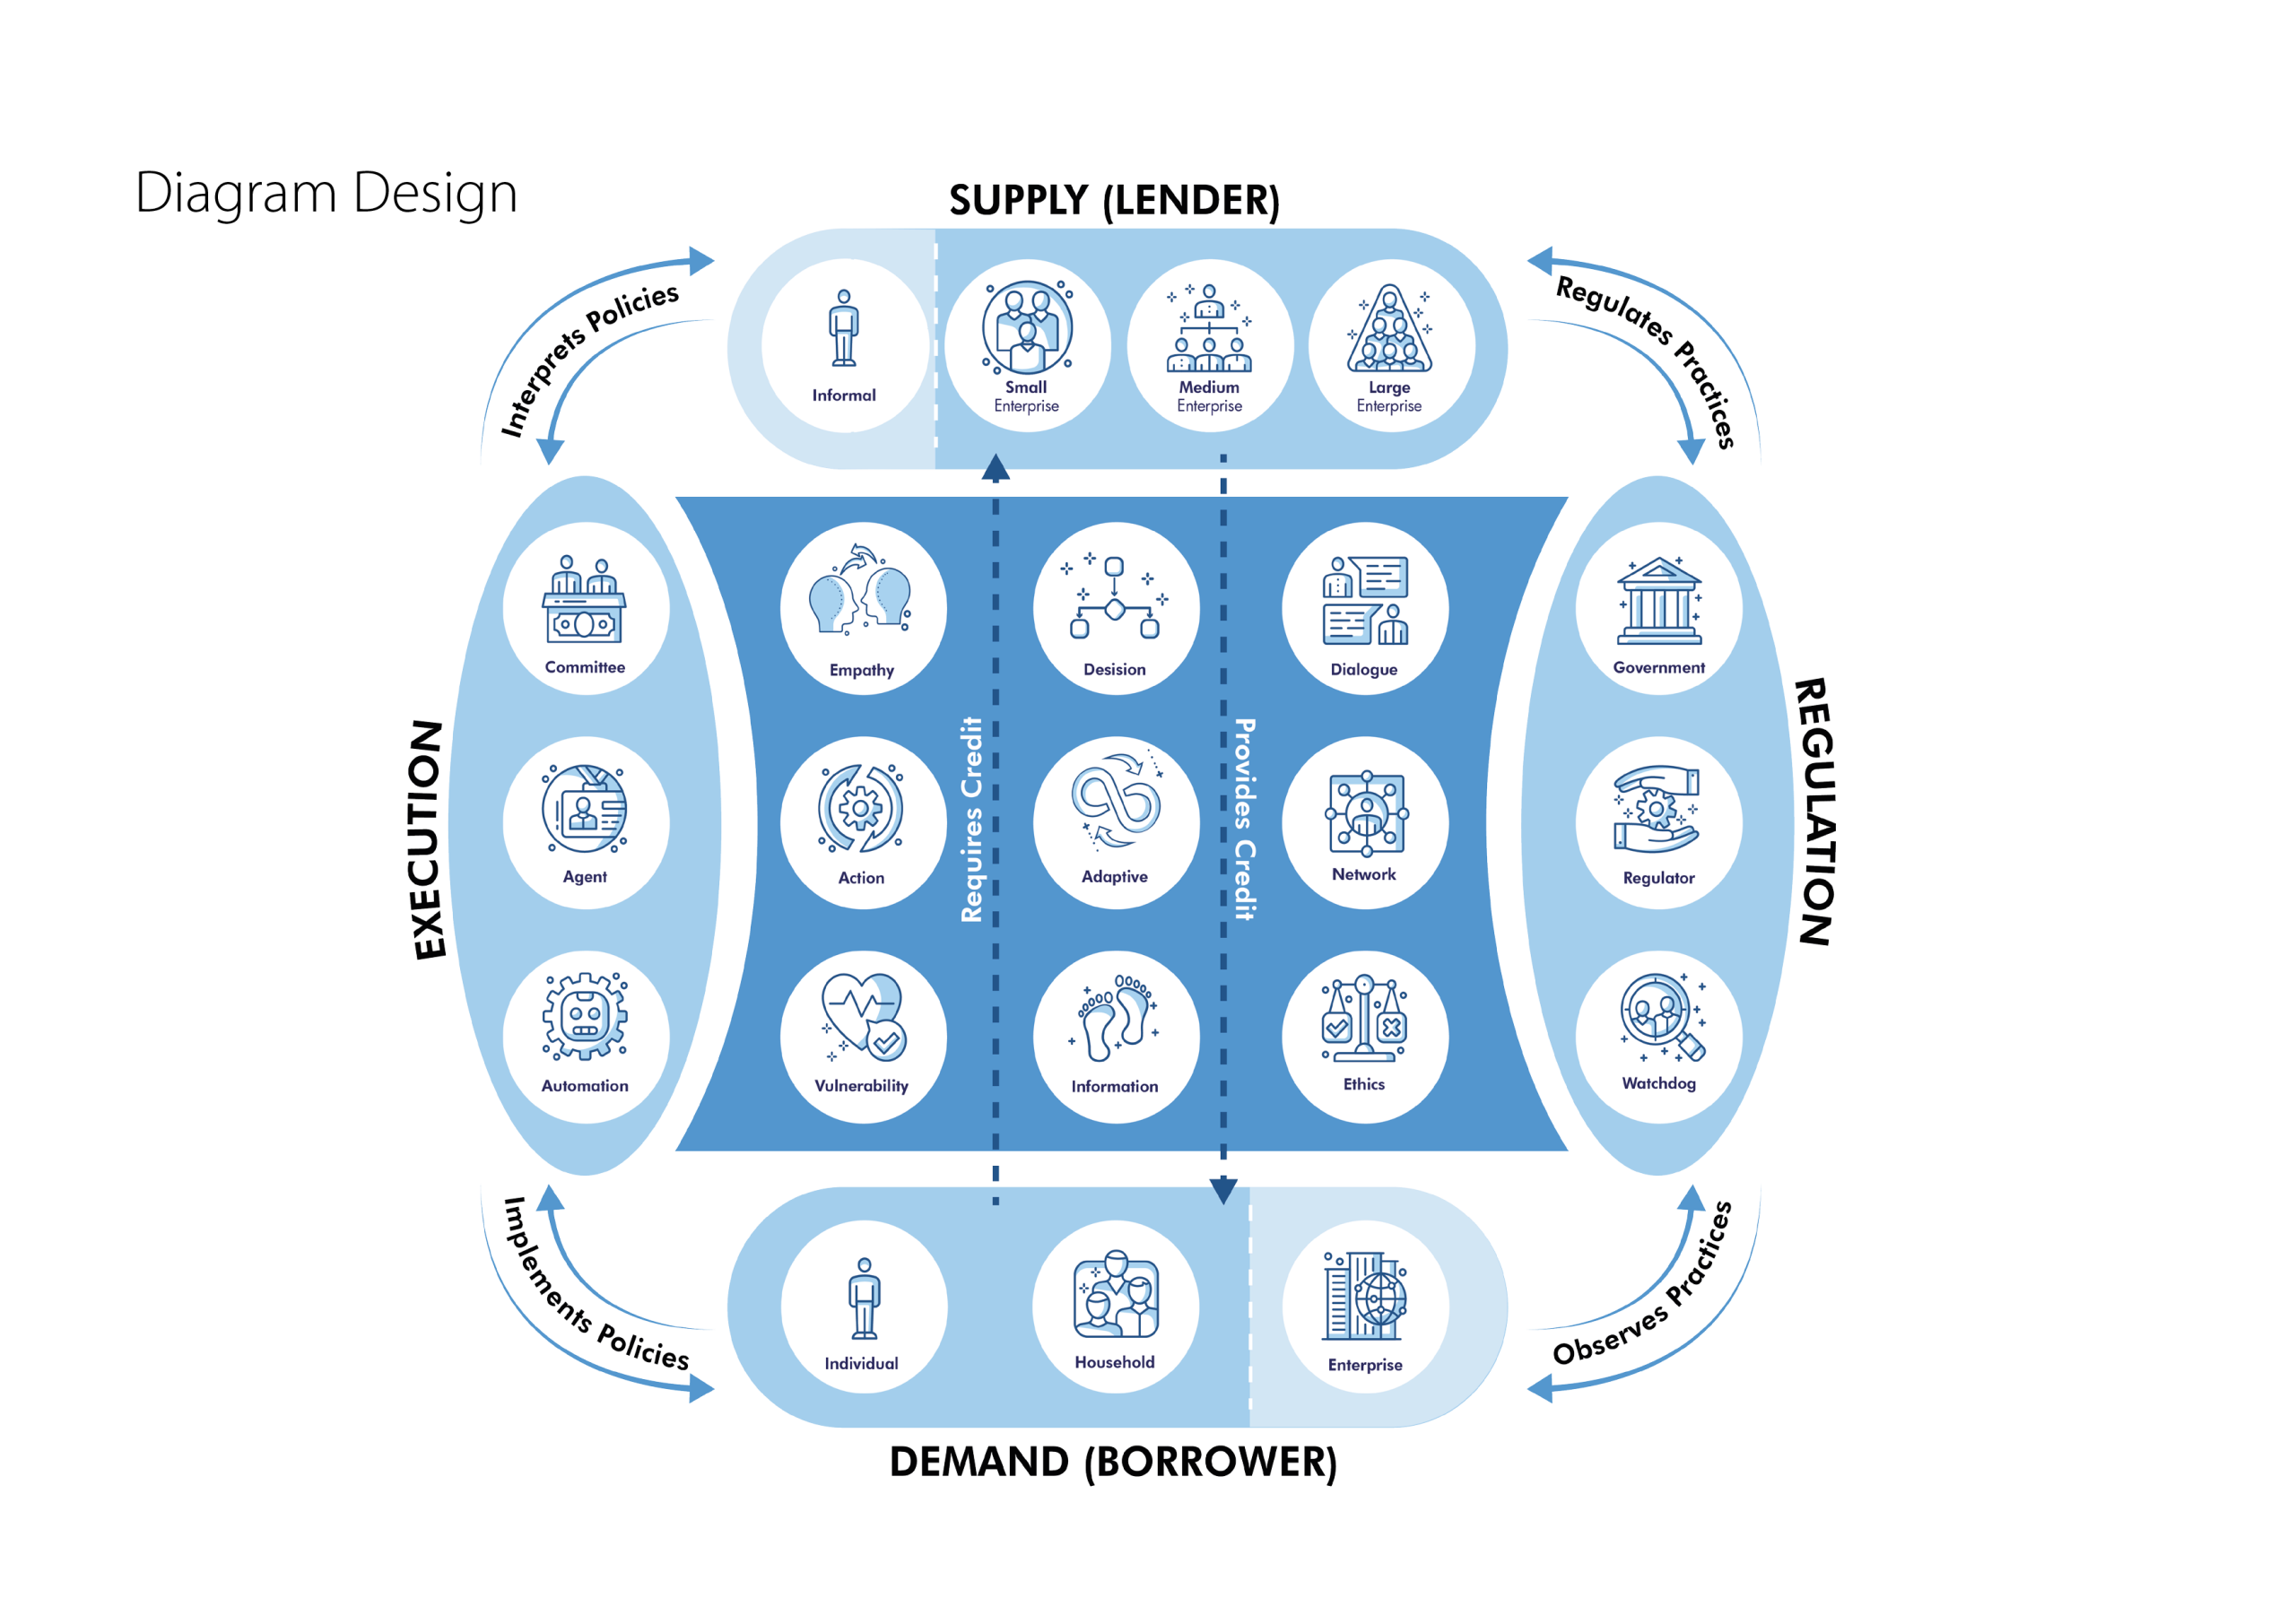
A centralized, multi-layered framework that aligns the four key pillars of a healthy credit market, categorizing the players and the specific qualities needed to bridge the gap between "Requiring Credit" and "Providing Credit"
Artboard 1

Project: Financial Inclusion and Credit System Design

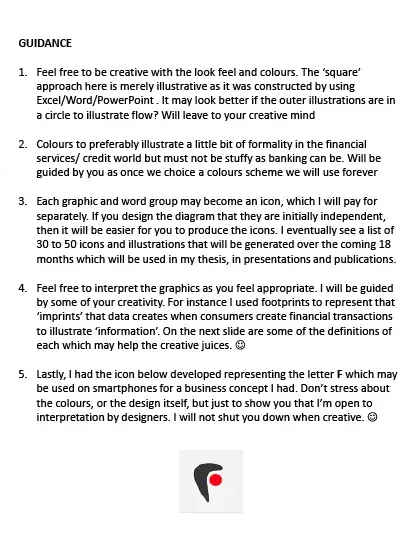
The Input: a text explaining how policy moves through the system and the style requirements
2

The Output:

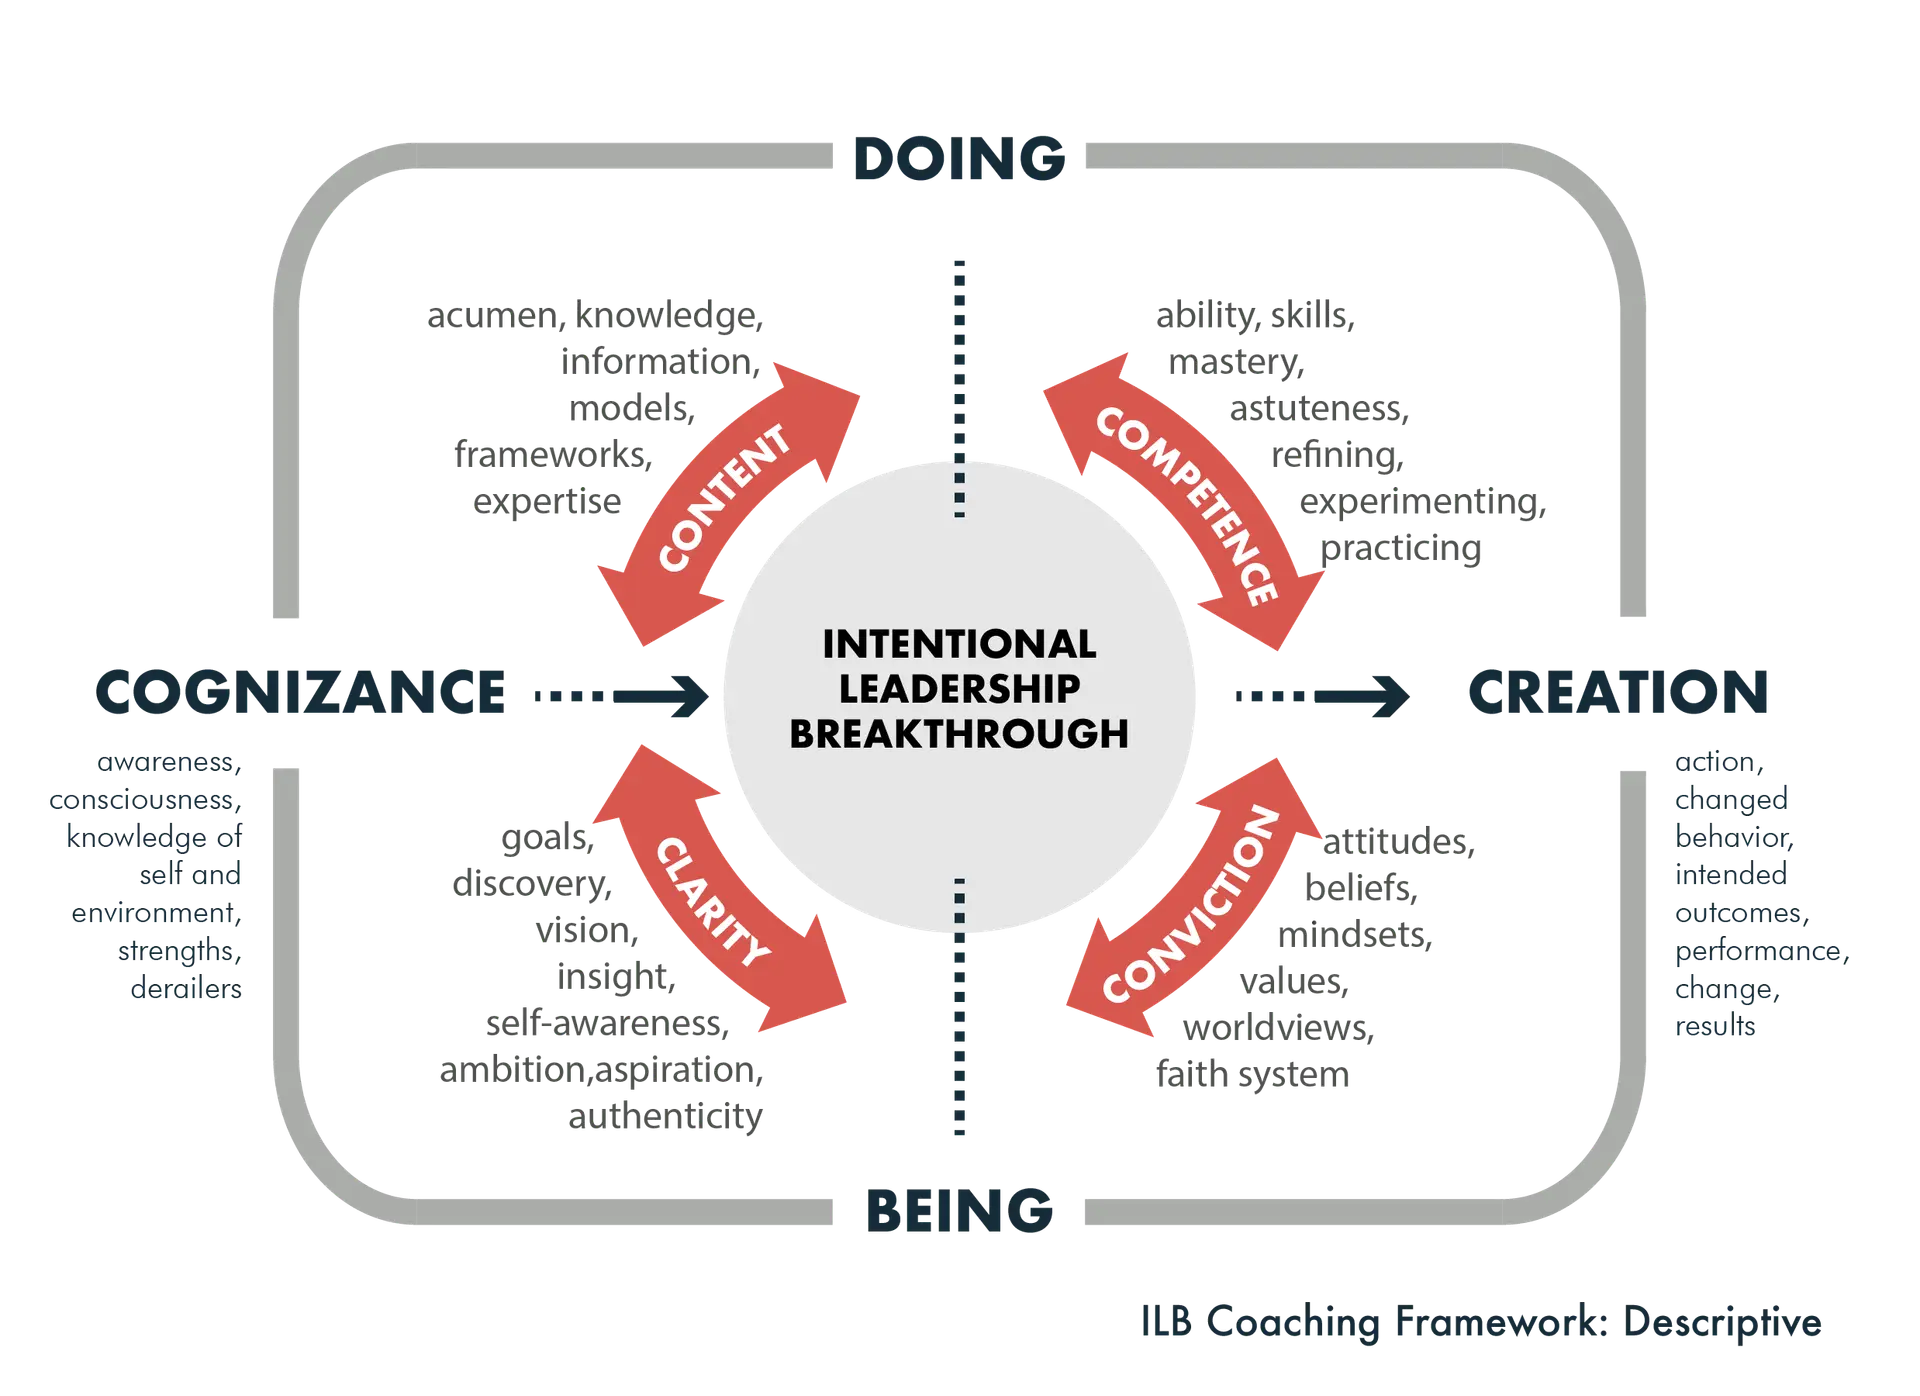
A unified, four-quadrant model that organizes these leadership elements into a cohesive journey from Cognizance to Creation.Flows from left to right, representing the journey, while the vertical axis highlights the two states of leadership.

IMG_6570

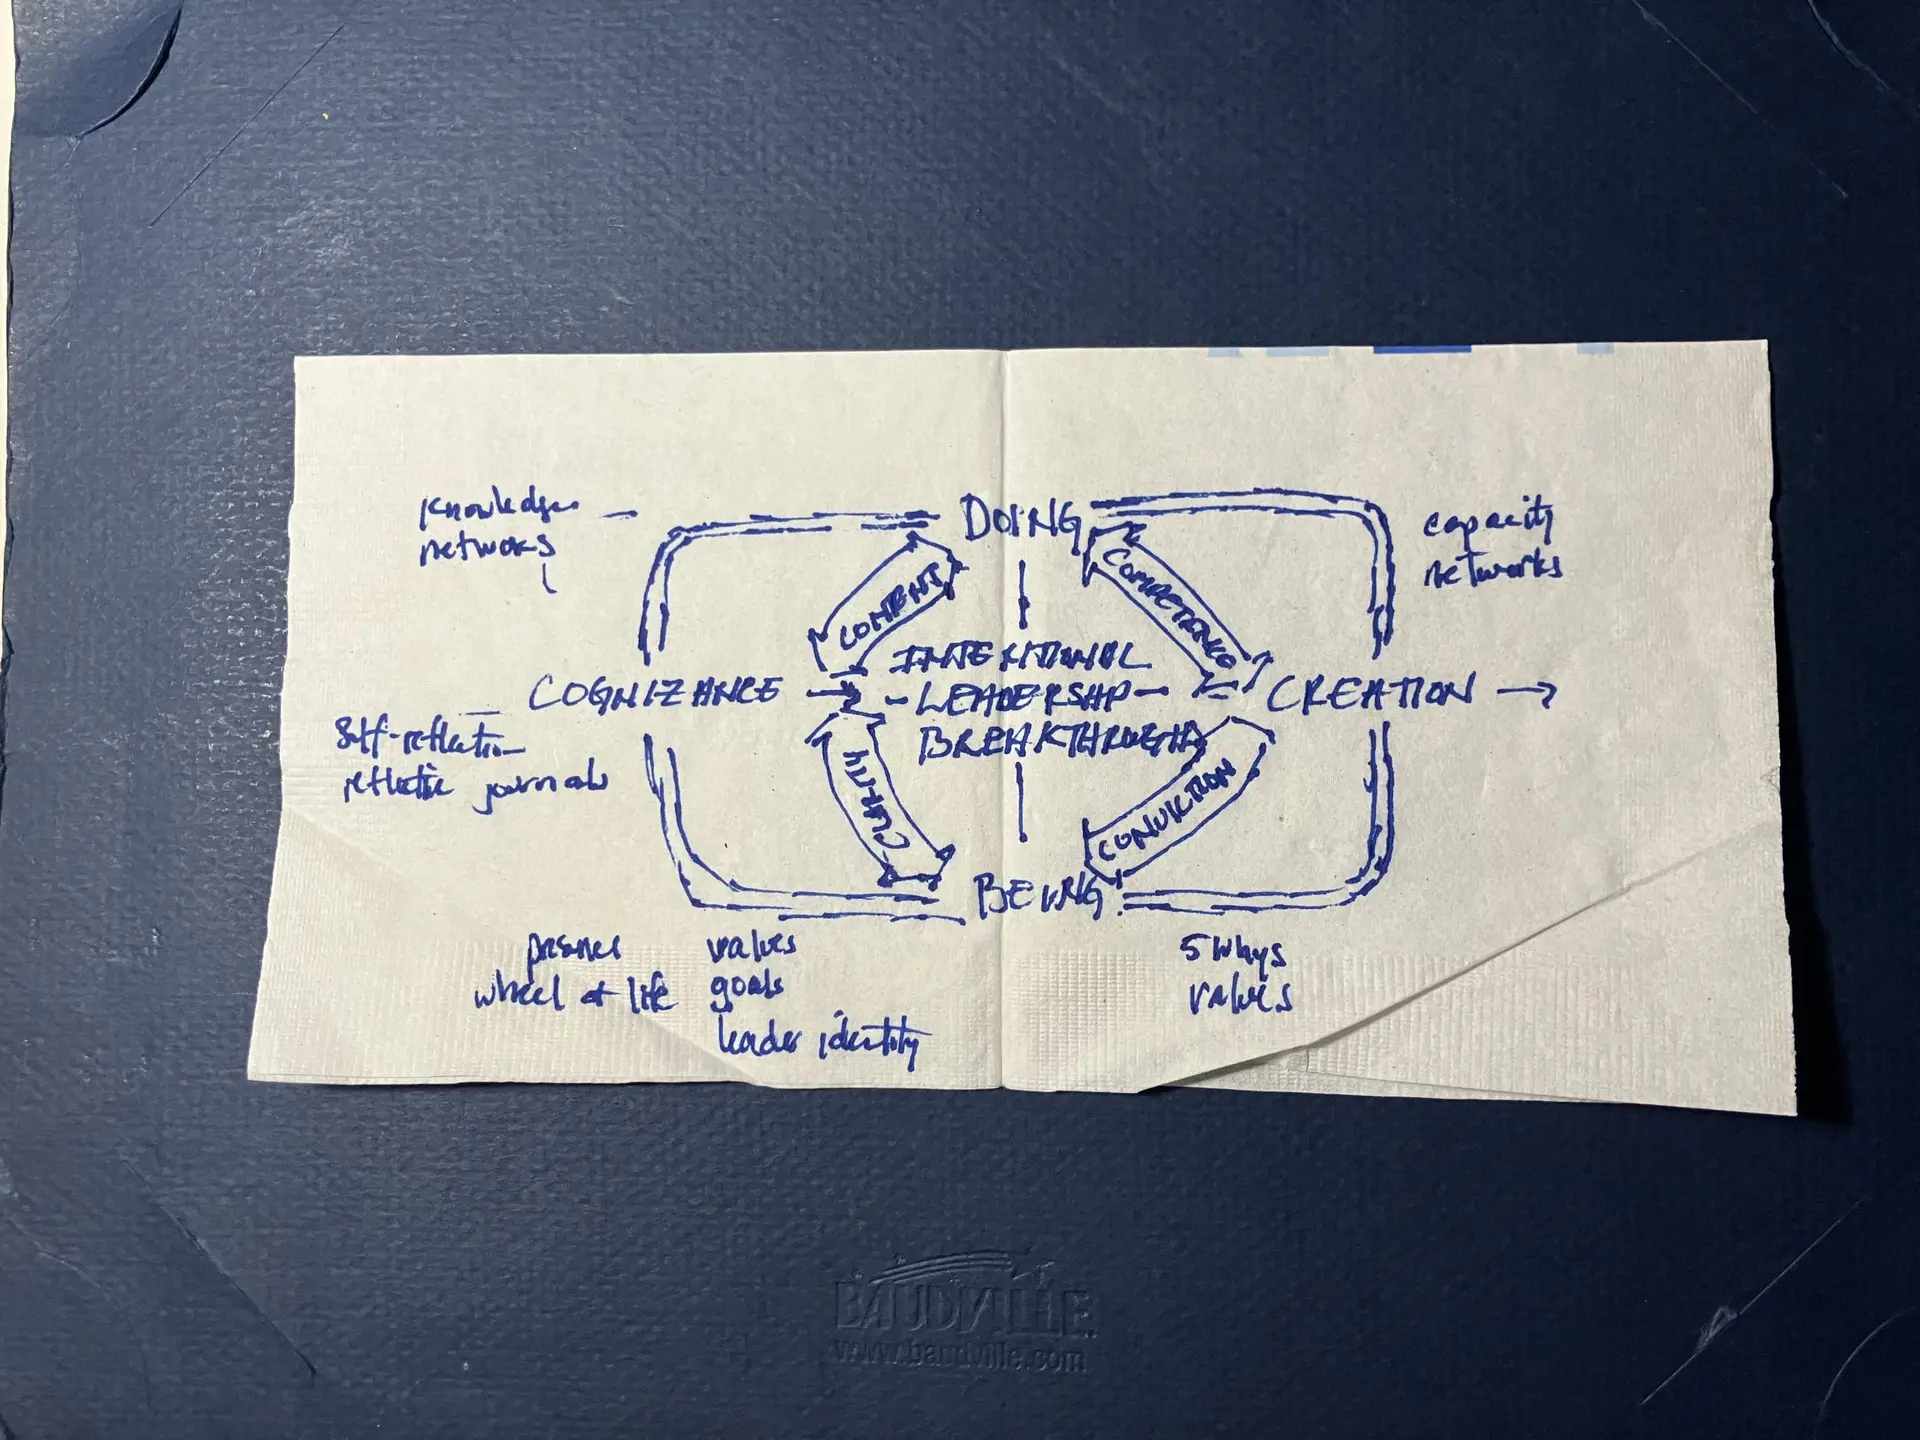
Project: Executive Coaching and Leadership Transformation.

The Input: A basic sketch that outlines a Leadership Development Framework
Artboard 2

Output:

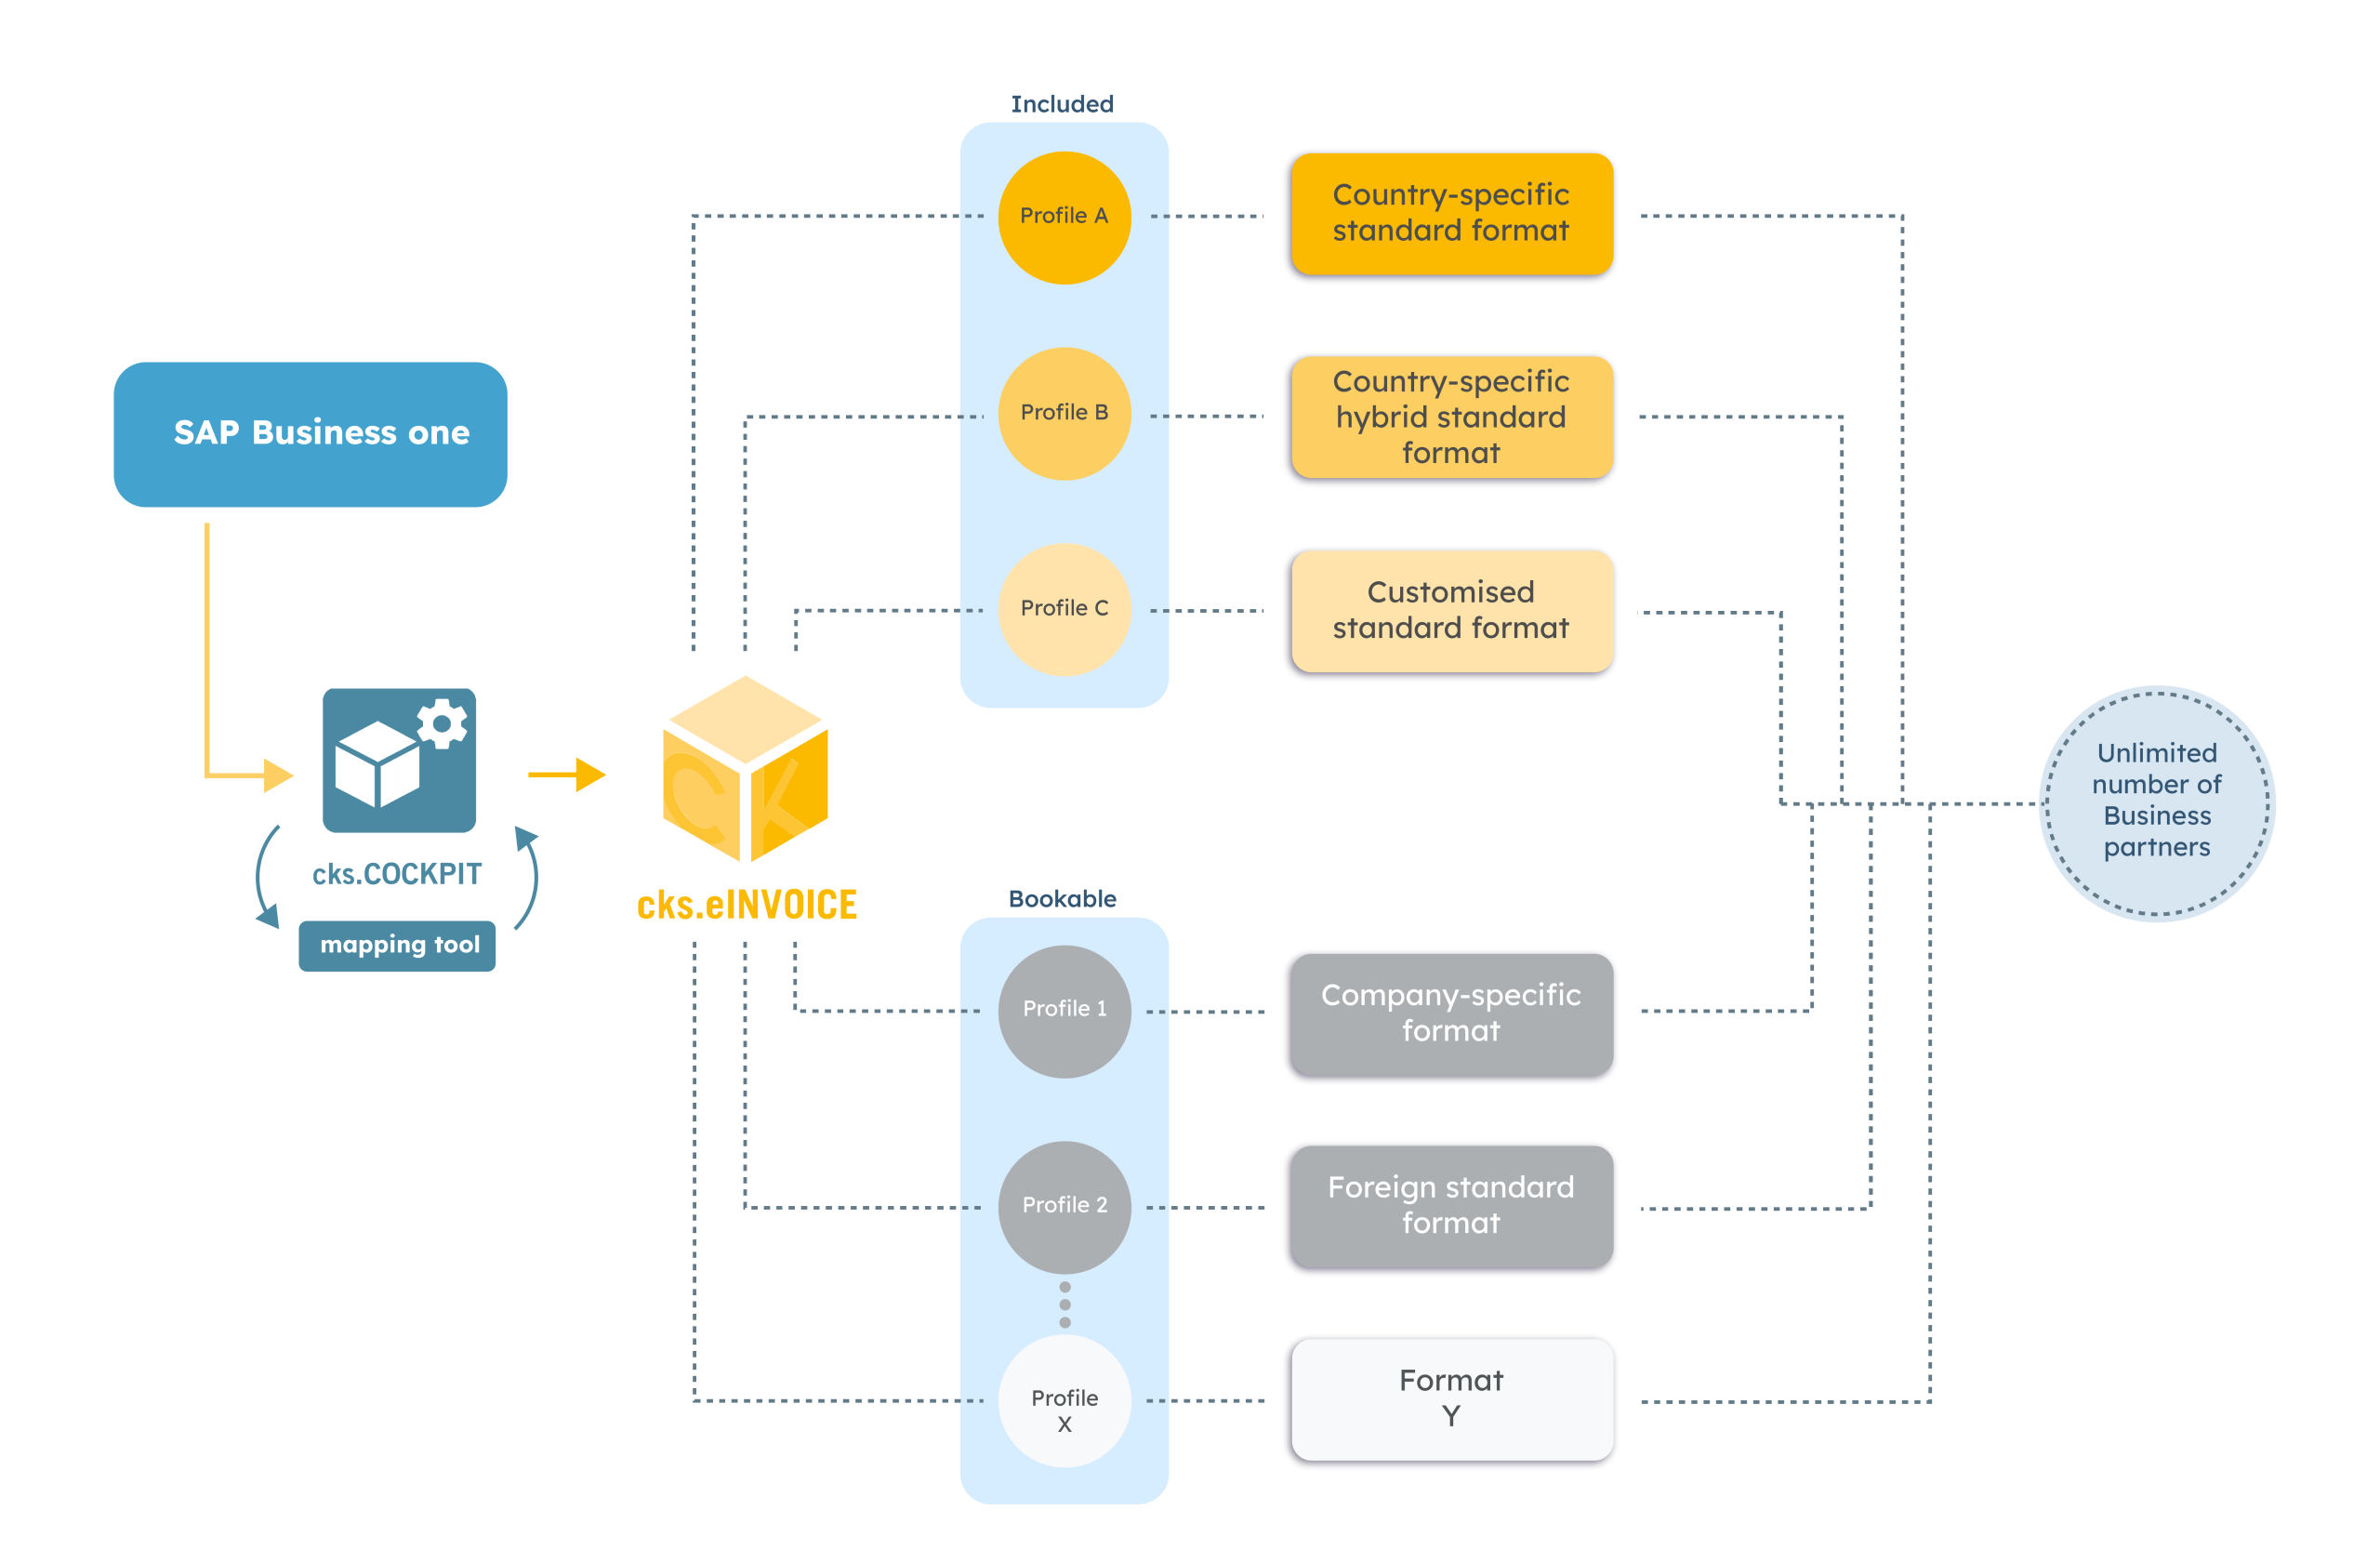
A refined, structured architectural diagram that groups these messy arrows into logical categories—separating "standard" from "custom" features and using branding to build trust.
Screenshot 2024-08-30 at 09.43.56

Project: Automated E-Invoicing Compliance and Distribution.

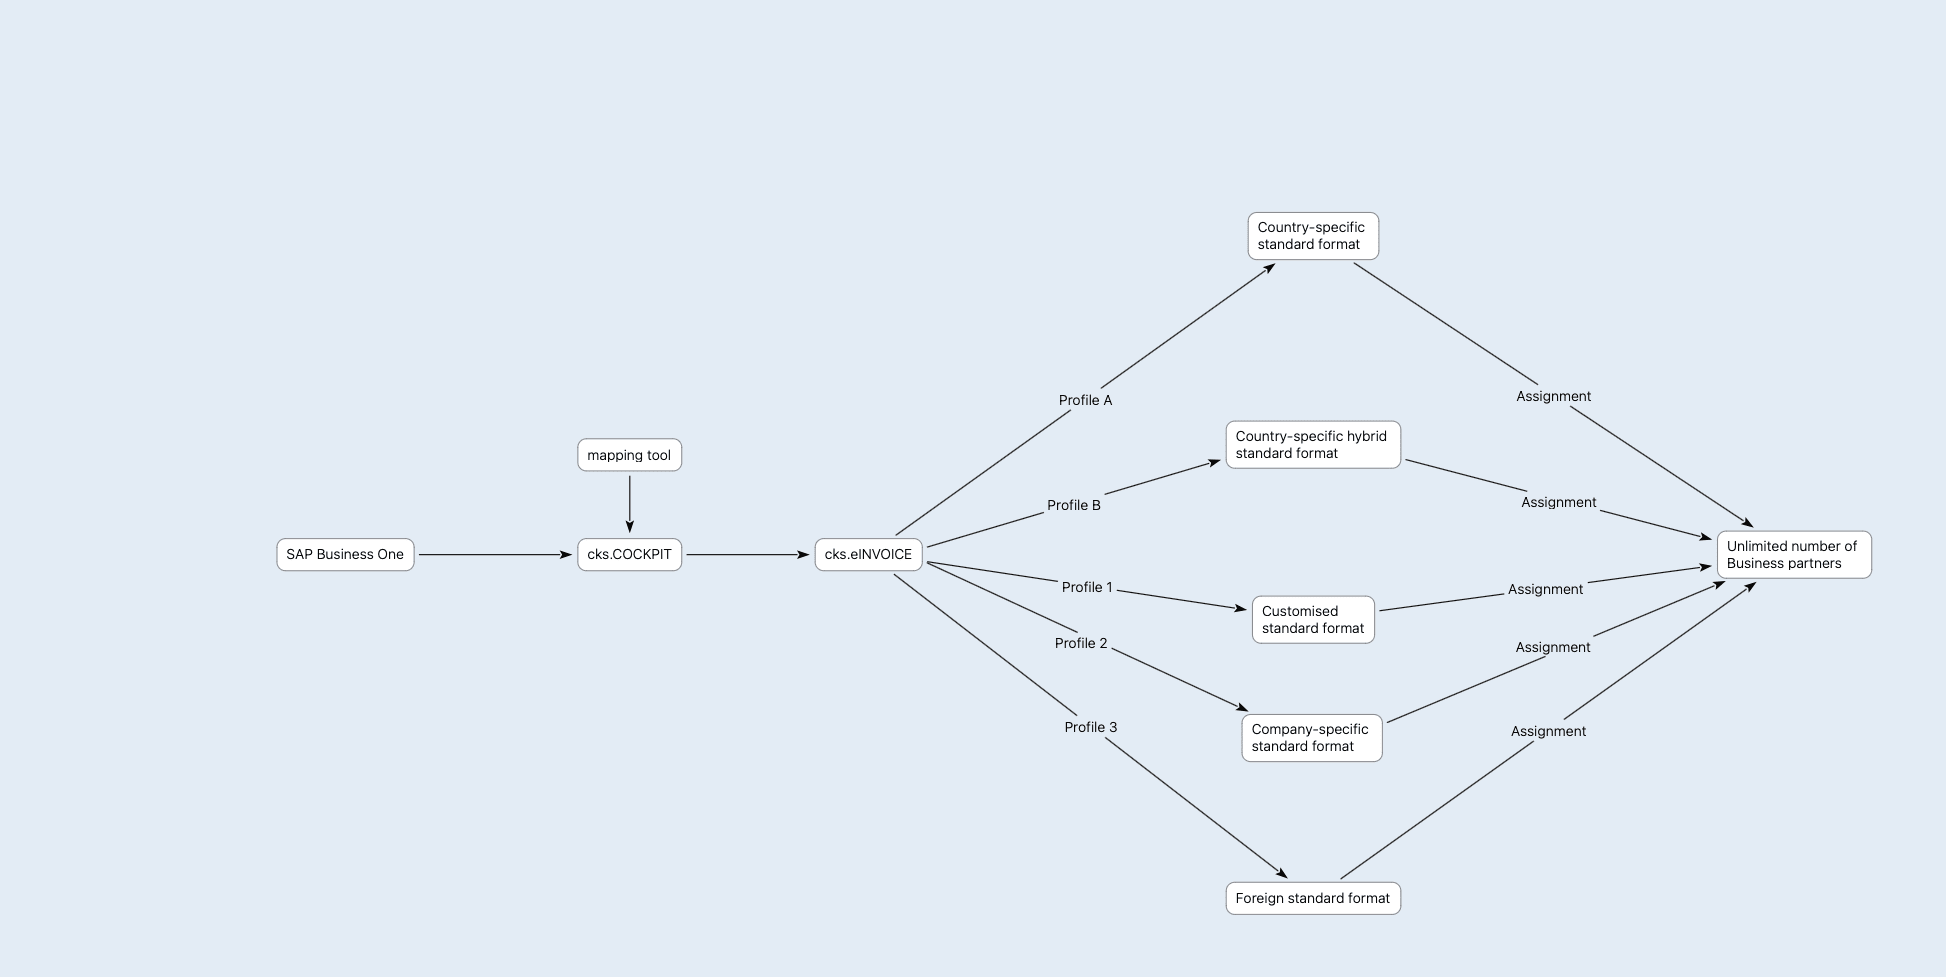
Input:A basic diagram While technically accurate, it’s a "messy" conceptual draft that focuses purely on the plumbing of the system rather than the user experience or service tiers
Artboard 8

Output:

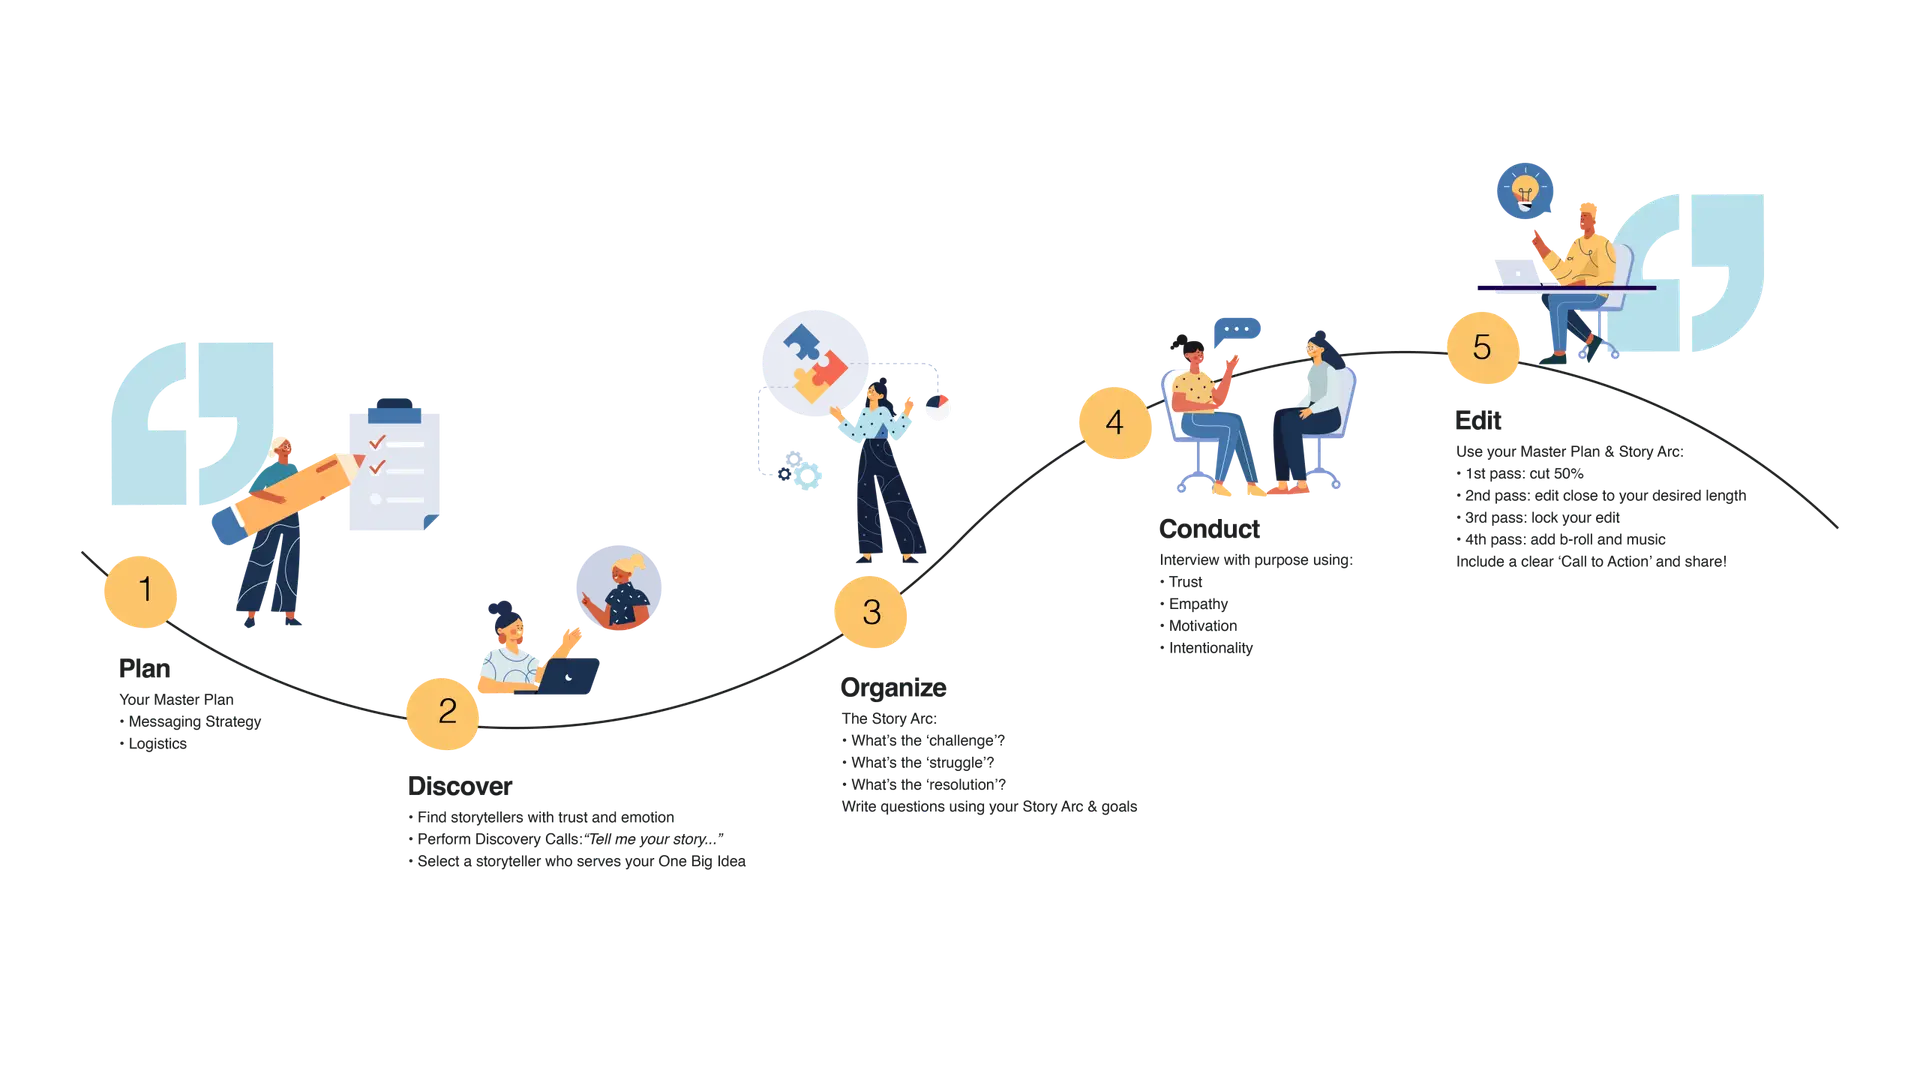
This transformation takes the raw data and turns it into a colorful, character-driven journey map about how to tell a story.
Screenshot 2026-01-29 at 11.18.26

Project: The StoryFind Proven Process: Nonprofit Storytelling

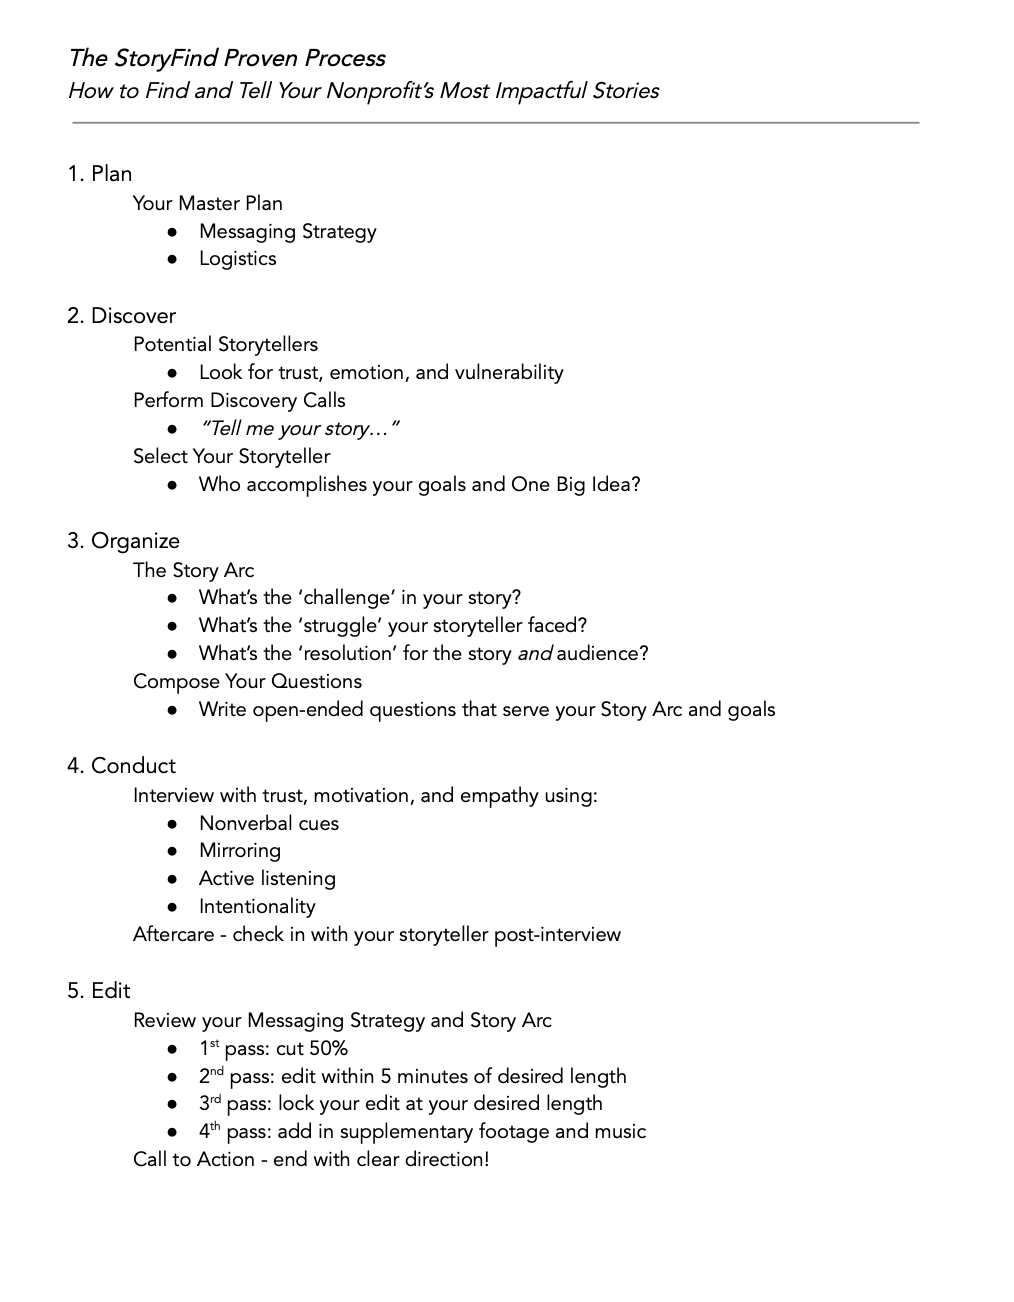
Input: A structured, hierarchical text document. It outlines the five-step "Proven Process" for nonprofits, detailing specific sub-tasks.

Ready for clarity?contact us

Skip the form and skip the prep work. Send us what you have, and we’ll tell you how we can visualize it.

 Attach your dense documents, messy whiteboard photos, or rough sketches. We will review your content and get back to you within 24 hours with a custom quote and a clear plan of attack.

contact us